Notably Inaccessible – Data Driven Understanding of Data Science Notebook (In)Accessibility

By: Venkatesh Potluri, Sudheesh Singanamalla, Nussara Tieanklin, Jennifer Mankoff
This website contains the Jupyter notebooks exported into HTML showing the code and the the intermediate datasets from the pipeline executions needed to reproduce every single figure in the research paper. More details about the pipeline and the data are available in the open source Github Repository.
| Research Paper | Dataset | Artifact (Github Repository) |
|---|---|---|
Attribution
If you use the datasets provided with this work, consider citing it as below:
ACM Reference Format (End Note)
Venkatesh Potluri, Sudheesh Singanamalla, Nussara Tieanklin, Jennifer Mankoff. 2023. Notably Inaccessible -- Data Driven Understanding of Data Science Notebook (In)Accessibility. In the 25th International ACM SIGACCESS Conference on Computers and Accessibility (ASSETS '23). October 22-25, 2023, New York, NY, USA. ACM, New York, NY, USA, 18 pages. https://doi.org/10.1145/3597638.3608417
LaTeX
@inproceedings{10.1145/3597638.3608417,
    author = {Potluri, Venkatesh and Singanamalla, Sudheesh and Tieanklin, Firn and Mankoff, Jennifer},
    title = {Notably Inaccessible – Data Driven Understanding of Data Science Notebook (In)Accessibility},
    year = {2023},
    isbn = {979-8-4007-0220-4/23/10},
    publisher = {Association for Computing Machinery},
    address = {New York, NY, USA},
    url = {https://doi.org/10.1145/3597638.3608417},
    booktitle = {Proceedings of the 25th International ACM SIGACCESS Conference on Computers and Accessibility},
    location = {New York, NY, USA},
    series = {ASSETS '23}
}
Table of Contents
- Figure 1: Pipeline Description
- Figure 2: Notebook Characteristics
- 2(a) relies on
data_out/processed_function_calls.csv - 2(b) relies on
data_out/nb_processed_cell_html.csv - 2(c) relies on
data_out/nb_processed_cell_html.csv
- 2(a) relies on
- Figure 3: Image Analysis
- 3(a) relies on
data_out/nb_processed_cell_html.csv - 3(b) relies on
data_out/model-results.csv
- 3(a) relies on
- Figure 4: Popular Imports From Usage
- 4 relies on
data_out/nb_processed.csv
- 4 relies on
- Figure 5: Notebook Navigability
- 5(a) relies on
data_out/nb_first_interactive_cell.csv - 5(b) relies on
data_out/nb_first_interactive_cell.csv
- 5(a) relies on
- Figure 6: Notebook Customizability
- 6(b) relies on
data_out/a11y-aggregate-scan.csv
- 6(b) relies on
- Figure 7: Accessibility Scan
- 7(a): relies on
data_out/errors-different-counts-a11y-analyze-errors-summary.csv - 7(b): relies on
data_out/errors-different-counts-a11y-analyze-errors-summary.csv
- 7(a): relies on
Pipeline Overview
This page contains links to the various notebooks that can be run to reproduce the figures presented in the paper. The figure below shows the pipeline that gets us the necessary datasets needed to generate these figures.
import base64
from IPython.display import Image, display
import matplotlib.pyplot as plt


def mm(graph):
  graphbytes = graph.encode("ascii")
  base64_bytes = base64.b64encode(graphbytes)
  base64_string = base64_bytes.decode("ascii")
  display(Image(url="https://mermaid.ink/svg/" + base64_string))
mm("""
   graph TD
A[fa:fa-database JetBrains Datastore 10M Dataset]
    -->|Download ntbs_list.json, pick 100K notebooks|B
B[fa:fa-database 100k-dataset.csv]
    -->|fetch_notebooks.py| C[fa:fa-book Download 100K Notebooks]
C -->|Store| D[fa:fa-file Data 100K Notebooks]
D -->|export_notebooks_to_html.py| E{HTML files by Theme}
E --> F[Darcula]
E --> G[Horizon]
E --> H[Material Darker]
E --> I[Solarized]
E --> J[Light]
E --> K[Dark]
J -->
    |process_notebook_html.py|L(nb_processed_cell_html.csv)
L -->
    |get_first_interactive_cells.py|M(nb_first_interactive_cell.csv)
F -->N{Scan}
G -->N
H -->N
I -->N
J -->N
K -->N
N -->|pa11y_scan_parallel.py|X[pa11y-results]
X -->|fetch_a11y_responses.py|O{Results}
O -->P(a11y-aggregate-scan.csv)
O -->Q(a11y-detailed-result.csv)
Q -->|generate_accessibility_error_counts.py|R(errors-different-counts-a11y-analyze-errors-summary.csv)
D -->|process_notebooks.py|S[Base64 Images]
S -->|classify_images.py|T(model-results.csv)
D -->|process_notebooks.py|U(nb_processed.csv)
U -->|analyze_function_calls.py|V(processed_function_calls.csv)
   """
   )
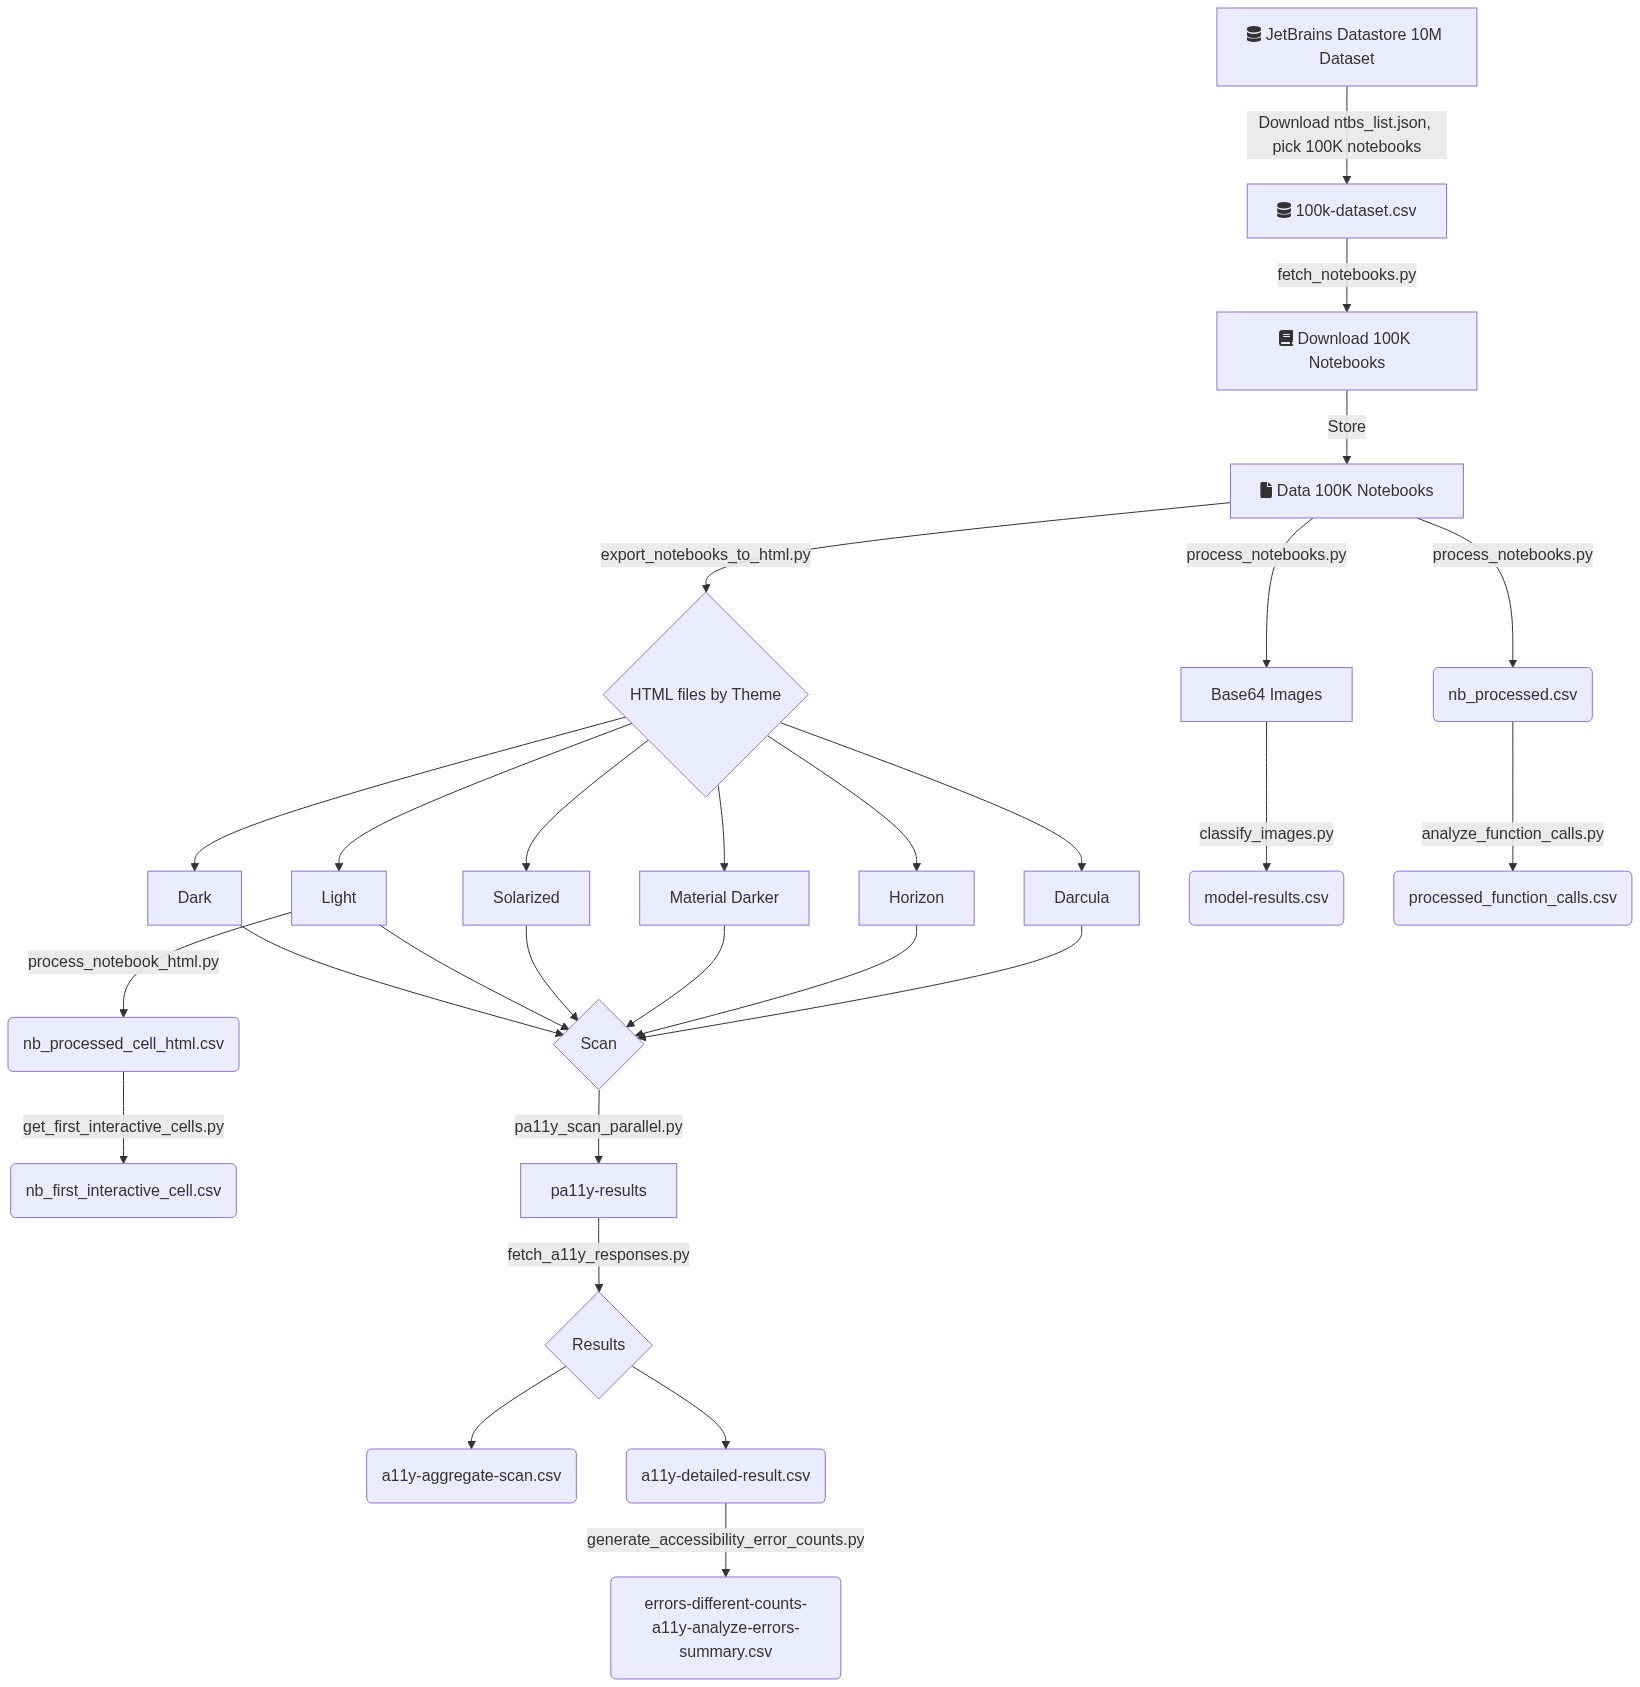
The figure above shows a mermaid flowchart diagram indicating the various stages in the pipeline and the scripts needed at each stage. The flowchart is interpreted top-down. An accessible and interactive version of the diagram can be found in the README file on GitHub along with the documentation of the pipeline and its description.